Logistic Regression
- Accuracy: 79.8%
- AUC: 0.68
- Max-depth of tree: None
Exigo helps you understand your models. Using the latest interpretation and fairness methods, Exigo generates a complete report that describes your model and data while giving insights on how to improve your systems.
Try it outExigó (εξηγώ) means "to explain" in Greek. We offer a dashboard for machine learning models that does just that: it explains, in various ways, the clockwork of lending models. Our dashboard will give credit analysts insights into the accuracy, fairness and reasons behind the model's decisions. We hope the dashboard will increase both a credit analyst's speed to make a decision and accuracy in making the right choices.
The high-level goal of our project was to create a tool that will be practically useful for credit analysts making decisions about which applicants to give loans to and which applicants to deny. We approach this problem with a dashboard that displays pertinent information for a credit analyst to make a decision with the aid of a machine learning model. Credit analysts will not only be aided by the model, but they will be able to see why the model made the decision it made.
This project is especially important in our current day and age. We are in a era where machine learning algorithms are rapidly growing in popularity and prevalence. These algorithms are making more and more decisions that effect people on a daily basis. Since the algorithms are only as good as the data we feed into them, they are susceptible to taking in and actually replicating a bias toward or against a protected class. This is a deeply rooted issue because the bias might not just be in a "sensitive" feature like race or religion that is in the dataset, but can be carried through other, allegedly safe, features that can act as proxies for the protected class. There is a ethical motivation to test our decision-making algorithms to ensure they are not biased against certain protected classes. In addition to treating all people fairly, in the context of lending, we need to be able to give reasons why a potential customer was denied a loan. Giving reasons for why a customer was denied a loan is not only useful for the customer, but required by General Data Protection Regulation (GDPR).
Show me the demoBefore we can really attack a problem, we have to know the data we are using inside and out. We are using a publicly available dataset from LendingClub that dates from 2007-2017 and has around 1.6 million loans and 151 different features. Although the dataset has 1.6 million total loans, Just under 50% of them are current loans that have not either been defaulted on or paid back. We will ignore these loans for modeling purposes, which leaves us with a dataset of around 850k loans.
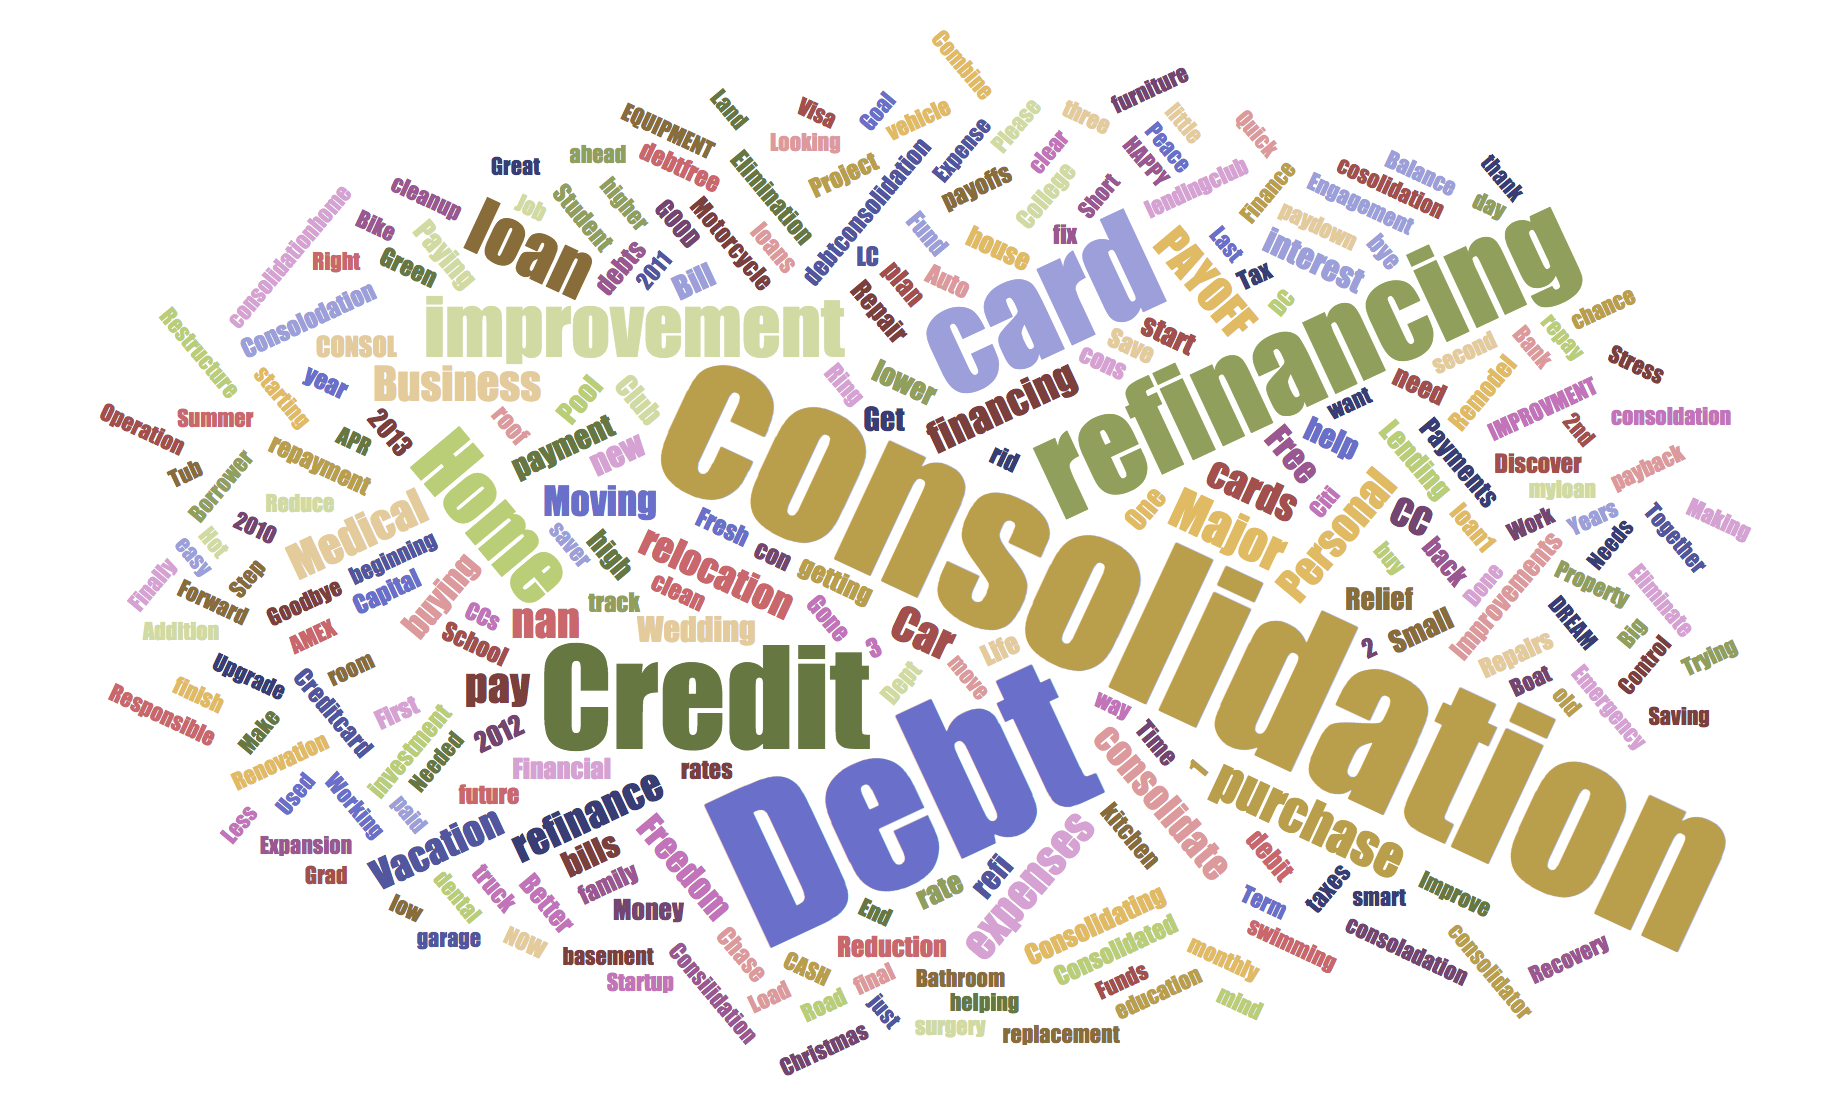
The words in this word cloud are the terms that come up most often as the reason for a potential client requesting a loan.
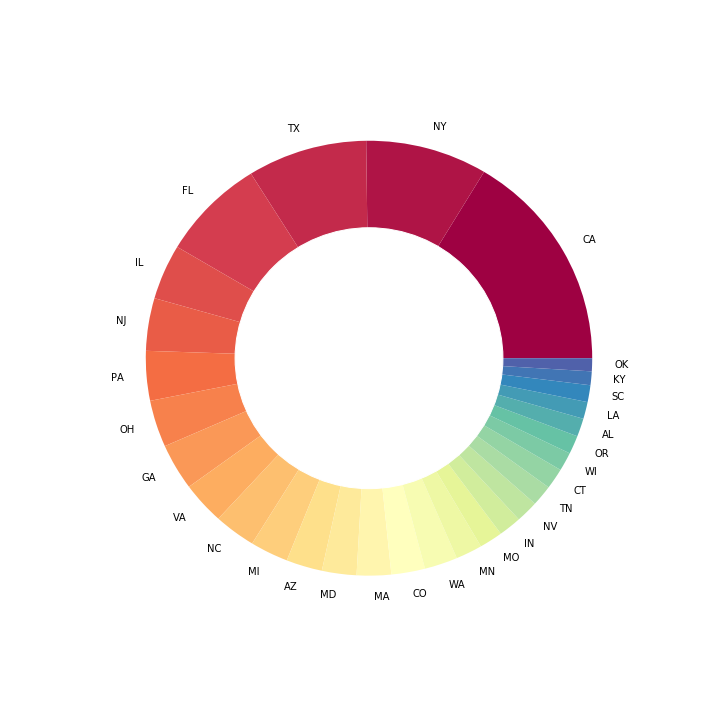
As we would expect, the two most prevalent states are California and New York.
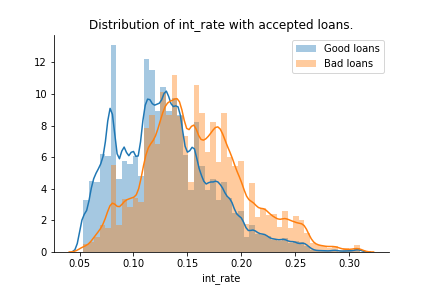
This plot shows the distributions of interest rate for clients that defaulted and clients that fully paid back their loans.
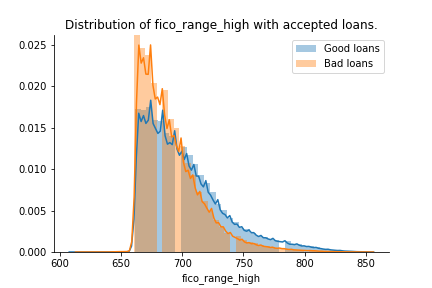
Here we see the FICO credit scores at the time the loan was granted to the customer. There is a hard cut at a FICO score of 660.
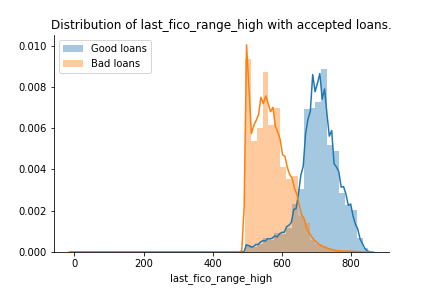
Here we see the FICO scores in real time. We can clearly see some borrowers who will eventually default have very poor scores.
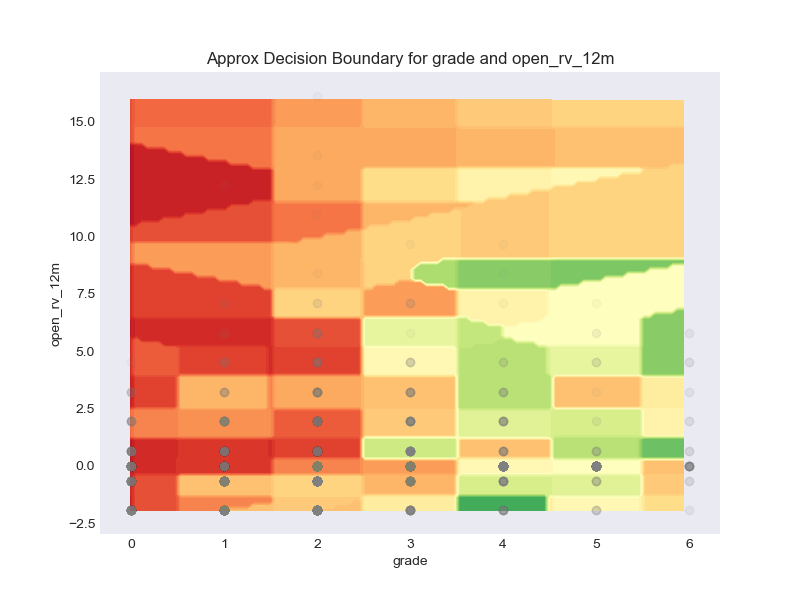
We can see what percentage of the dataset different combinations of classes make up. Here we show Loan Grade, Length of applicant employment, and Loan Term, respectively to get a feel for the composition of the dataset.
In this plot we can see the average loan amount change over time. The loan amounts are split into two groups based on whether they eventually defaulted or fully paid back the loan. Here we can see a general upward trend in loan amount and a general trend that loans defaulted on are higher than loans fully paid back.
Here we review the papers that were most useful to us in deciding which direction to follow throughout the project.
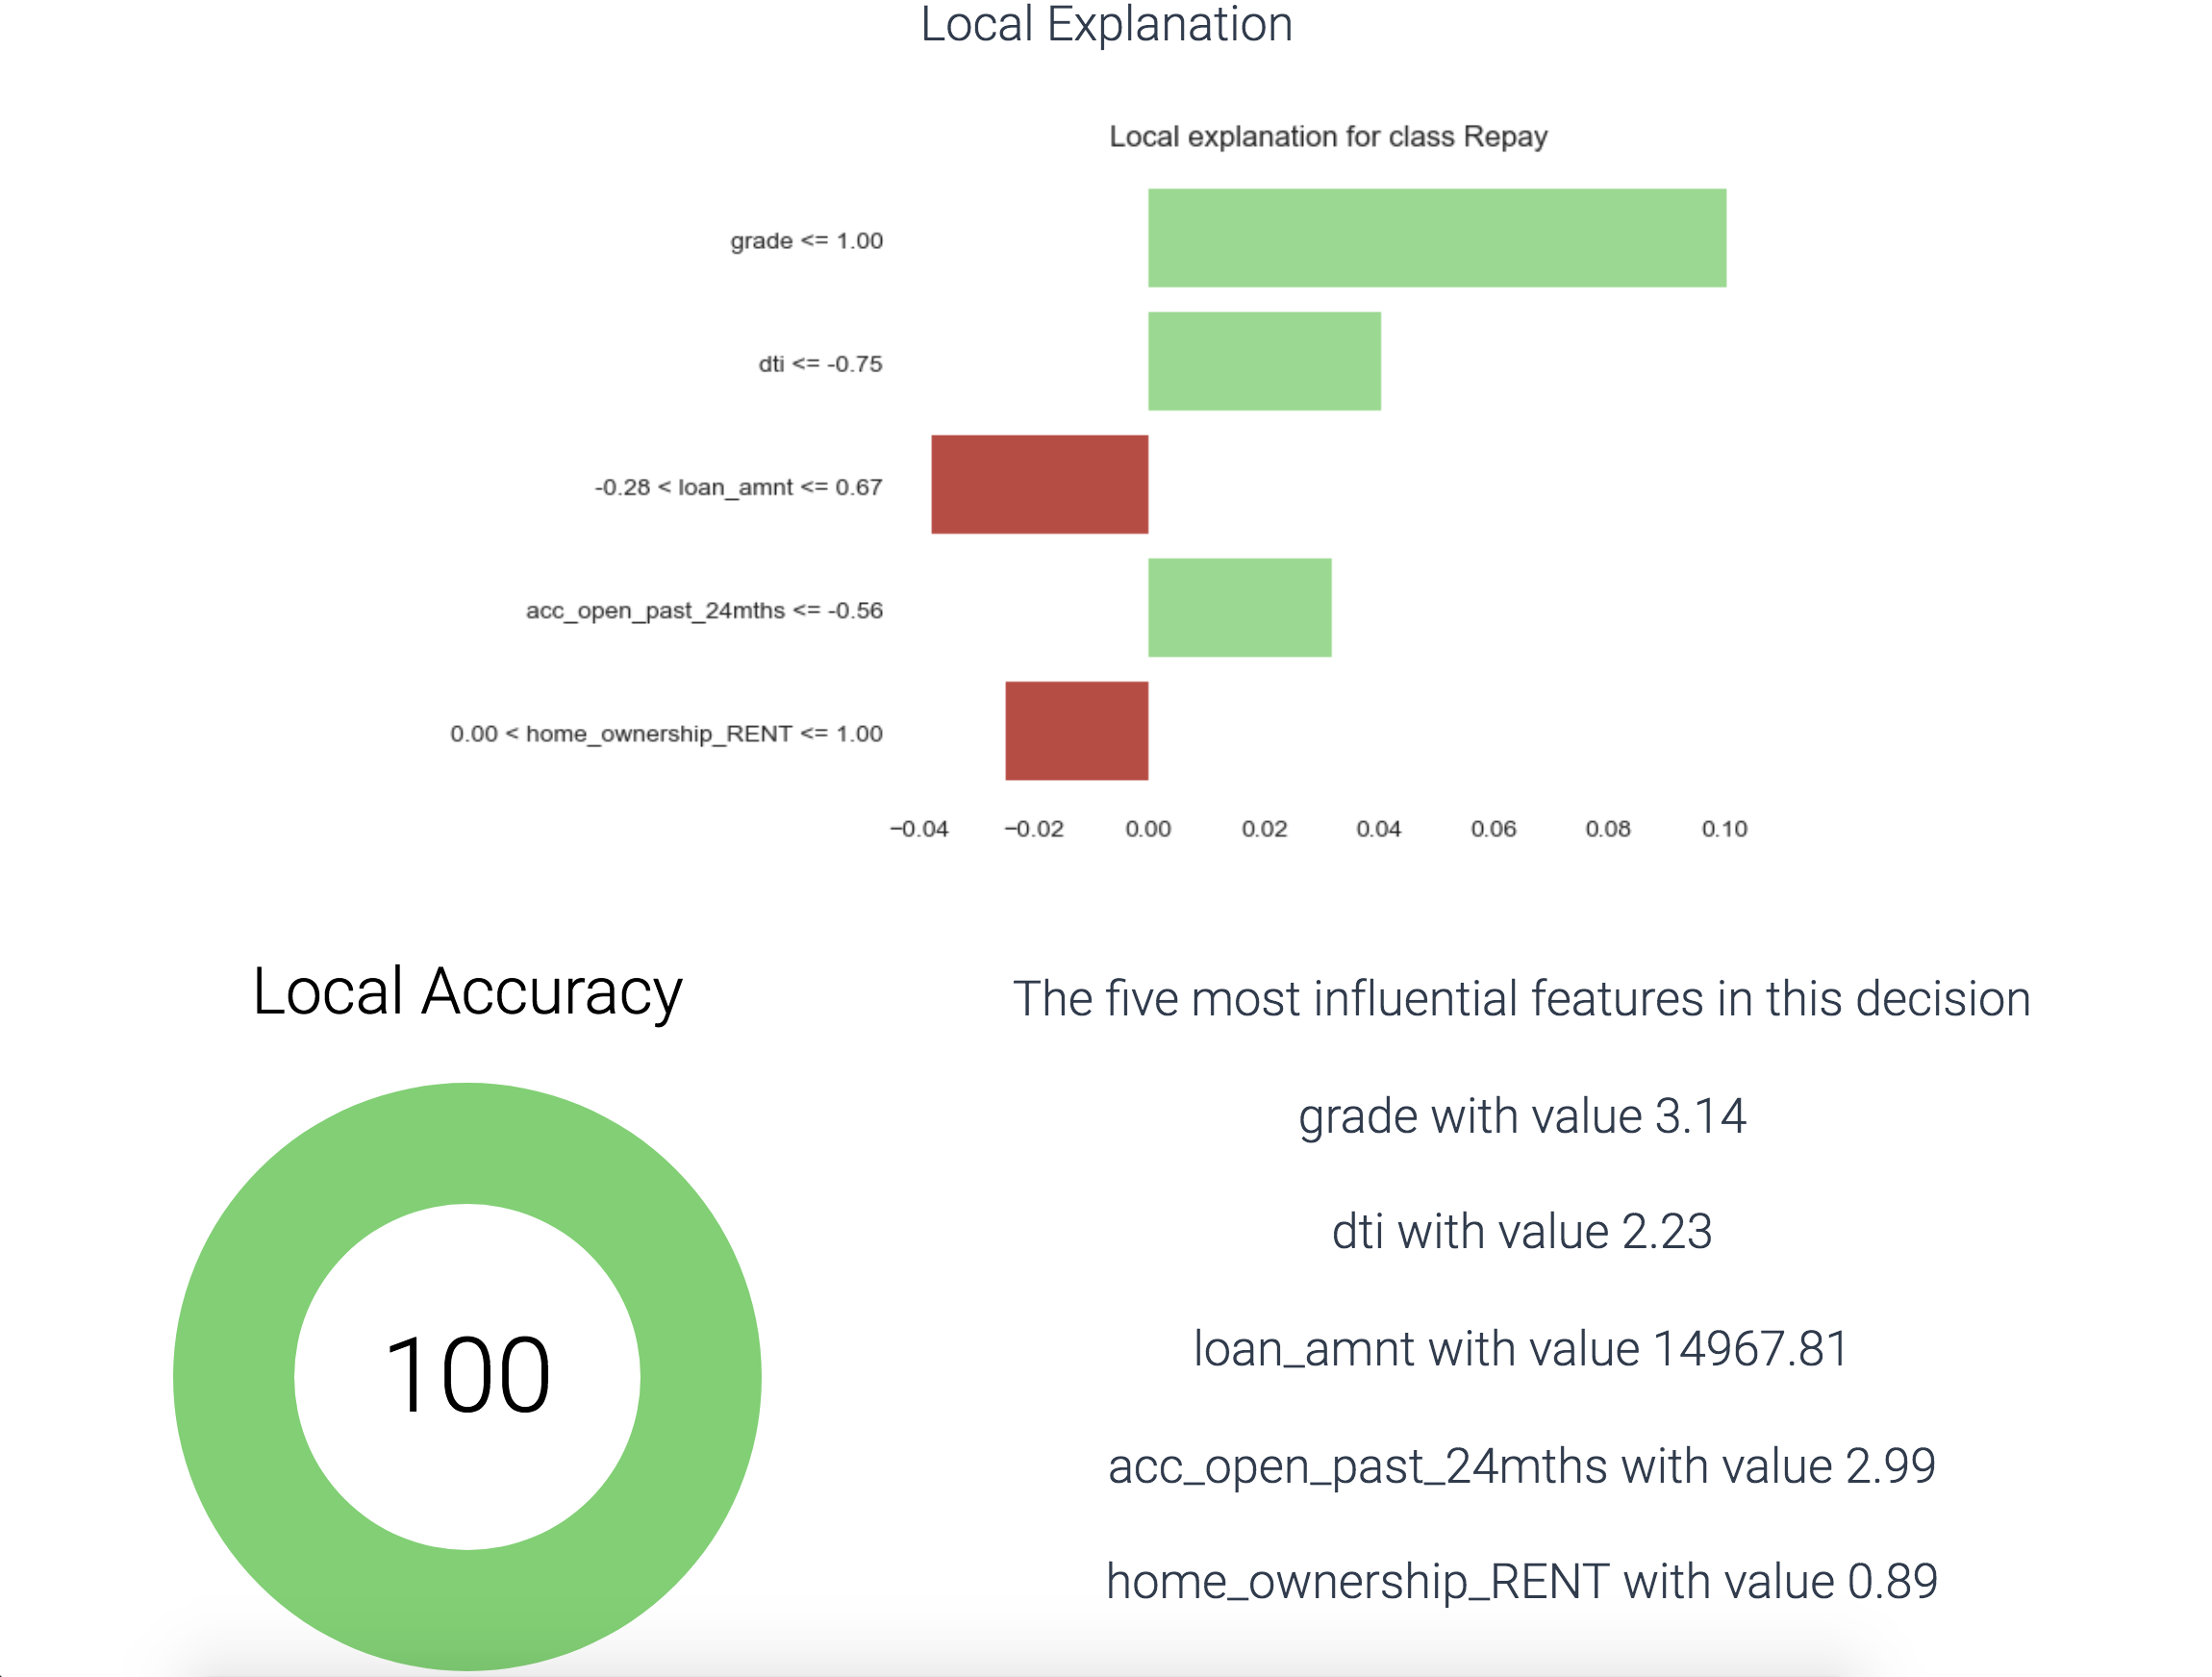
LIME is one of the most important elements of our final dashboard. we use this method to explain the local results of the model in question and how much they influence the final decision of the model. LIME fits a local linear approximation with a subset of the available features to the function at a single point and uses the value of the coefficient on the features to determine which ones are the most important.
Ribeiro, M.T., Singh, S. and Guestrin, C., 2016, August. Why should i trust you?: Explaining the predictions of any classifier. In Proceedings of the 22nd ACM SIGKDD International Conference on Knowledge Discovery and Data Mining (pp. 1135-1144). ACM.Input Gradient is another critically important method we use in our dashboard's interpretability sections. Input Gradients work by taking the gradient with respect to the x values (inputs) of the model to see how the result of the model changes for small changes in the input. Presumably, the features with a large gradient (i.e. that cause large change in the result of the model for a small change to the feature's value), are the features that effect the output of the model the most.
Hechtlinger, Y., 2016. Interpretation of Prediction Models Using the Input Gradient. arXiv preprint arXiv:1611.07634.This paper was one of our favorites and gave us the four main metrics we use to evaluate the fairness of a model. This paper goes in depth with different statistical definitions of fairness and the justification for each metric. The four metrics we use from this paper are statistical parity, conditional statistical parity, false positive rate, and false negative rate.
Corbett-Davies, S., Pierson, E., Feller, A., Goel, S. and Huq, A., 2017, August. Algorithmic decision making and the cost of fairness. In Proceedings of the 23rd ACM SIGKDD International Conference on Knowledge Discovery and Data Mining (pp. 797-806). ACM.Our main objective during this project was to generate a responsive report that could give insights on fairness and interpretability measures in a model-agnostic way. To accomplish this, we generated different models, implemented fairness methods and interpretability techniques. We describe the work below.
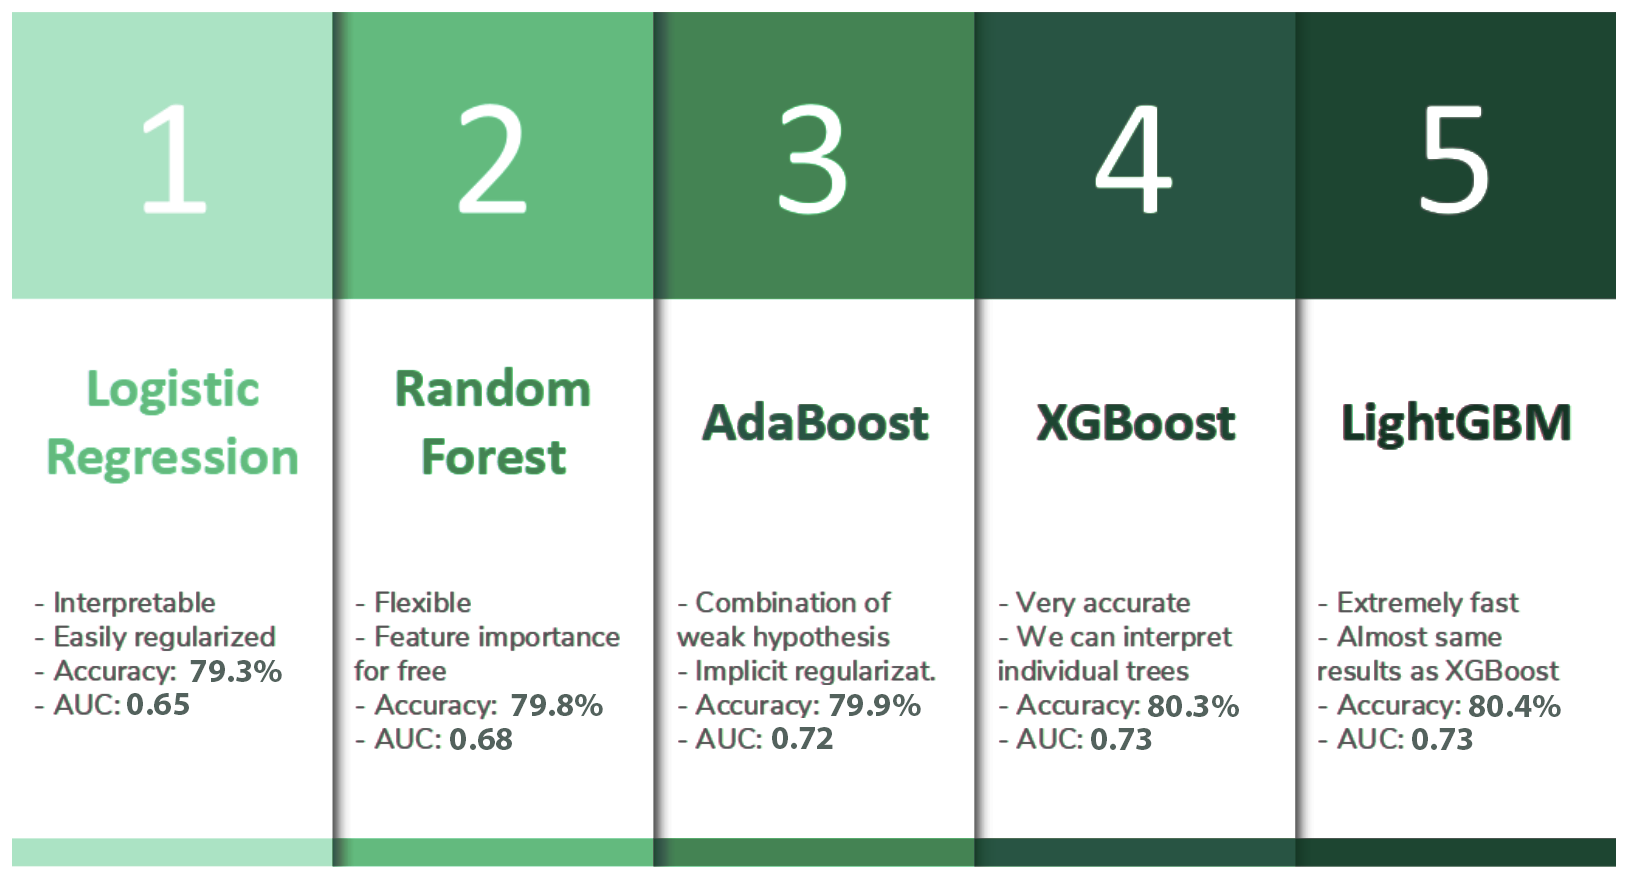
Our project focus is determining accurate metrics for fairness and interpretability, so we naturally needed a varied set of models to test our algorithms on. With that in mind, we decided to train 7 different models on the LendingClub dataset, with varying parameters and values, so that we could later on test our interpretability metrics on them. It is important to remark that accuracy was not our prime objective, but we were instead looking for varied models to refine our final deliverable: the dynamic report. The main models analyzed were:
The training problem was set up as follows: we tried to predict if a particular client was going to default or repay their loan, given 114 features that describe their situation and characteristics (data points obtained from the publicly available LendingClub data). The data has a lot of categorical features and unusable predictors, so a round of data cleaning was needed. We removed useless predictors such as client id and loan id, transformed dates into categoricals and categoricals into one-hot encoded variables, removed columns with zero variance, and finally applied mean imputation to the cleaned dataset to fill out all the NaN values.
We ended up with a dataset containing 194 features. This was fed to our models and we observed an unreasonably high accuracy on most of them. After this, we realized that some features clearly contained information posterior to the loan outcome. We removed most during the initial cleaning, but some remained. Features such as debt_settlement_flag, a flag that indicates if a charged-off borrower is working with a debt settlement company, were easy to detect as post-facto, but other features such as funded_amnt, the total amount committed by the loan, were harder to catch: it turned out to be the total amount after a repay
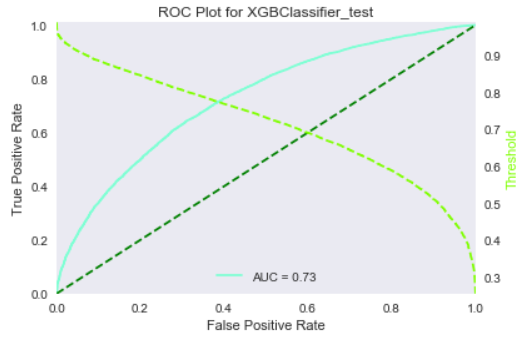
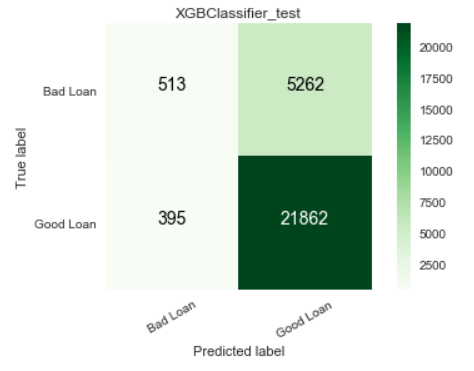
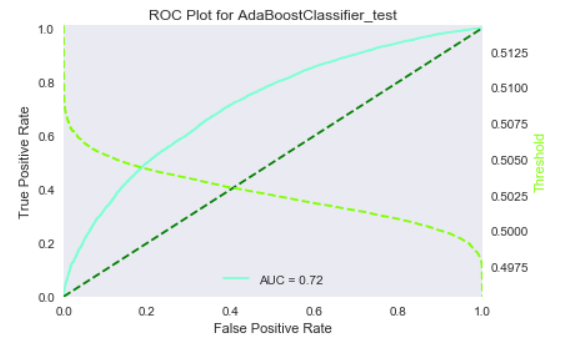
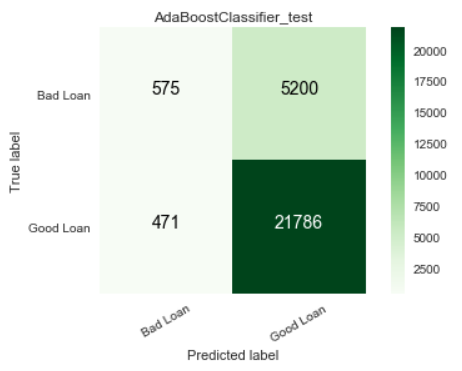
After removing the post-facto features, we ended up with a new model with 147 features that had much more realistic results. We operated hyperparameter search with a grid search approach on all of our models. We show below the models implemented with their respective metrics and parameters.
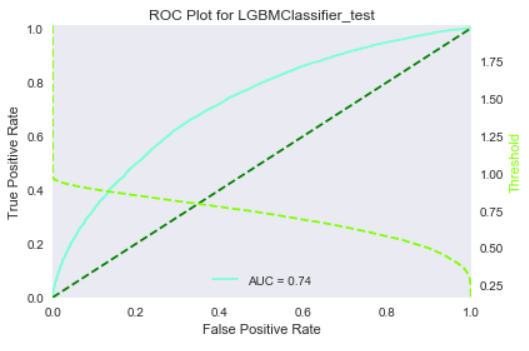
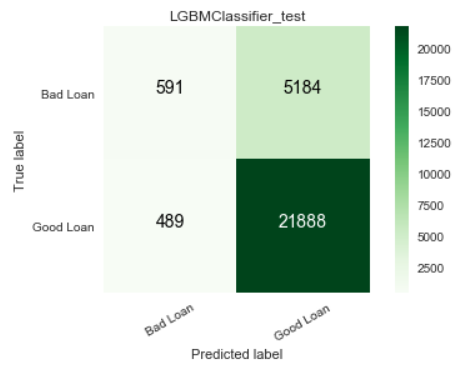
As this is a highly imbalanced problem, we also obtained ROC curves and confusion matrices for our models, to further present the performance of our model. These figures are part of the final report that we generate later on. We present some of them below.
Local interpretation models are the core of our interpretation functionality. Our objective for local interpretations is to take a black-box model and its training set and return a ranked set of features that drive the model outcome.
We worked with three primary methodologies to produce local explanations for a given observation:
We ultimately discarded this methodology, though, as it requires a well-defined loss function and therefore breaks our requirement of working with black-box models. We attempted to circumvent this issue by reproducing a black-box model with a feed-forward neural network - this would in theory generate a loss function for a black-box model and hence allow us to utilize Influence Functions. However, in practice this was unproductive; the neural net was an "approximation of an approximation" and we had difficulty reproducing an arbitrary model with any practical accuracy.
Each of our selected feature estimators (LIME and Input Gradients) require a linearization on the decision manifold in the local region around the observation. As such, there is inherent error in the explanations. While we cannot eliminate the error, the next best thing is to provide a confidence in the output. We built three methods for evaluating the confidence in the reasons for any given observation:
We used the various local explanation methods and their respective confidence measures to produce a number of visualizations for the end-user. These are:
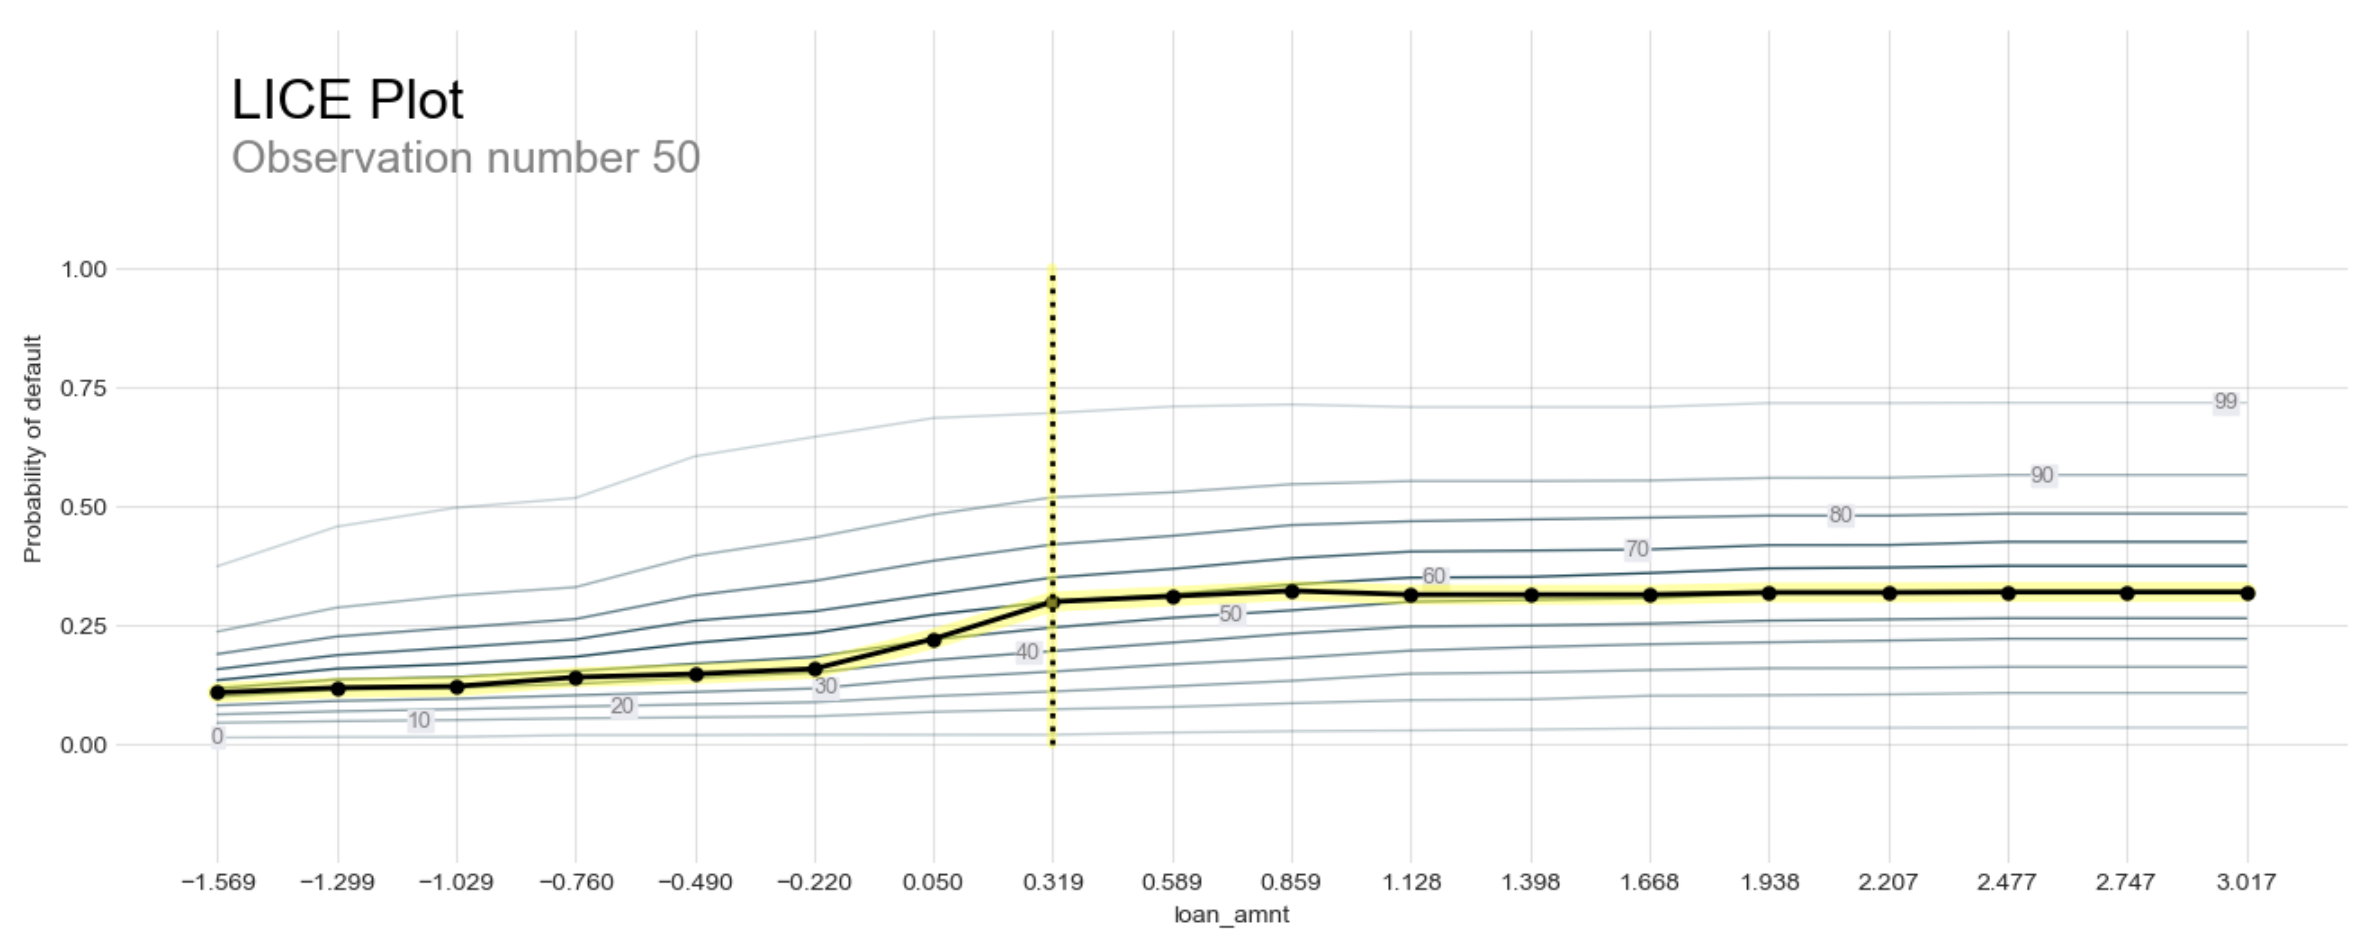
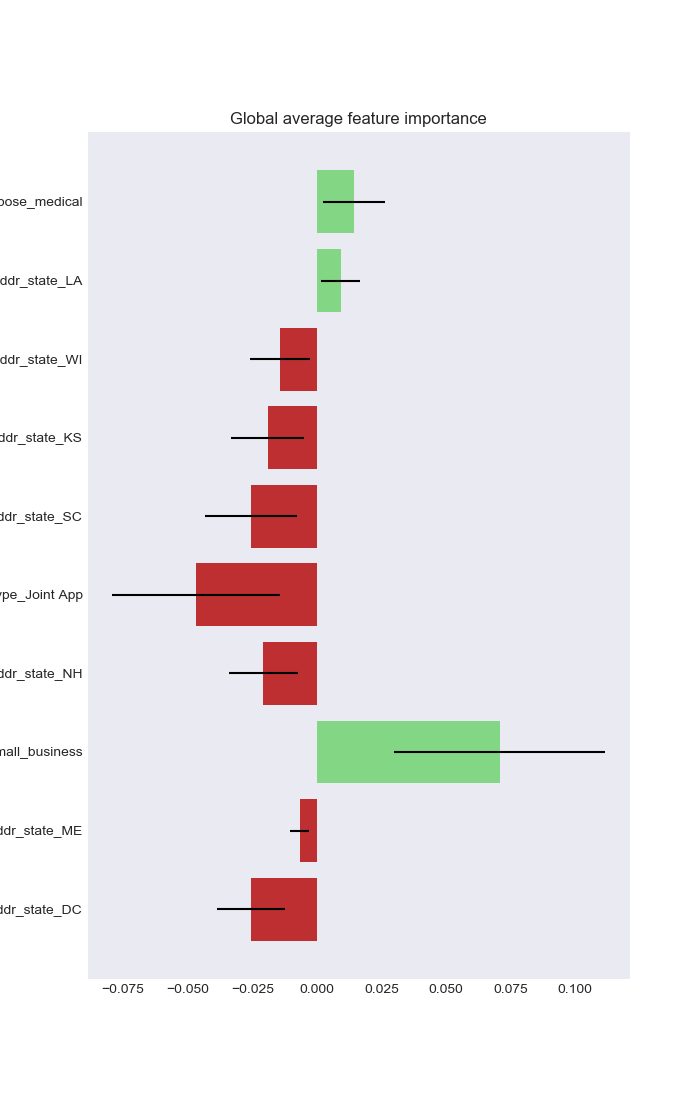
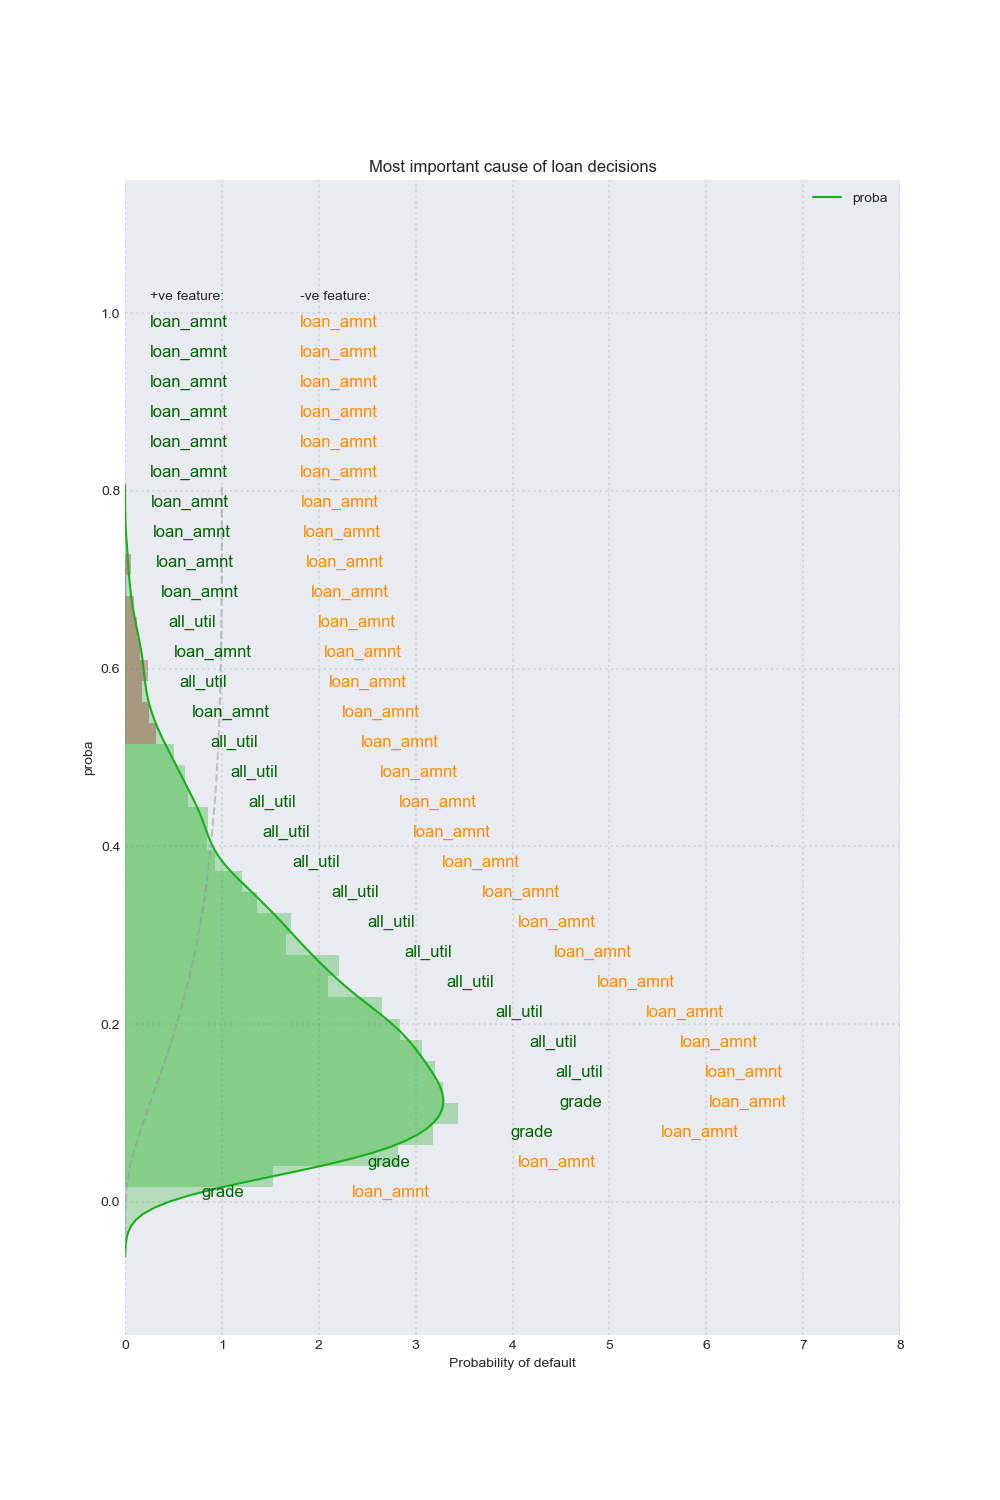
Having access to observation-level decision reasons opens up a world of analysis possibilities at the aggregate level. We are able to detect regional or global patterns in these reasons and visualize them to provide unique glimpses into the model's performance and the shape of its input data. The visualizations we performed are:
As Artificial Intelligence becomes more powerful, algorithm-based decisions have become increasingly common for various problems for everything from automated lending to parole hearings. With this trend comes the issue of ensuring fairness along with other key aspects such as accountability or transparency. The EU General Data Protection Regulation (GDPR, enacted during the course of this project), regulates that anyone subject to an algorithmic decision has a right to an explanation. As such policies go into effect, explaining a black-box model such as neural network and controlling undesirable patterns in its decision-making become essential. As legal frameworks continue to be established, organizations that use algorithms to make important decisions could face legal risk. If their models were to exhibit statistically significant discrimination, they may face litigation. In particular, our cursory review (the authors are admittedly novices in the practice of law) shows that class action lawsuits are in particular subject to statistical examination due to their stochastic nature. As a first step to codifiyng such issues, we study different ways of quantifying the fairness.
We present the three, perhaps most universal, metrics that quantify the level of fairness. These are global fairness metrics because they look at how the model in question makes decisions overall for a protected group vs. the entire population. By protected group, we mean groups based on sensitive characteristics such as gender, religion, or race. When an algorithm is completely rule-based (where each rule is specified manually by a human) it is relatively easy to evaluate its fairness because one can review each individual rule. However, the powerful inference models we use today have complex inner-workings to inspect and hence, usually the best we can do is understand their statistical behaviors. Most of the best inference models we use today take an probabilistic approach and hence, we measure the fairness in terms of expectations. We expand on that approach with a battery of staistical tests for evaluating different fairness conditions:
shows an equal portion of protected class and general population is expected to receive loans. The bias can be defined as the absolute difference of the two terms below.

shows an equal portion of protected class and general population is expected to receive loans, conditioning on a set of pre-specified features. The bias can be defined in the same way.

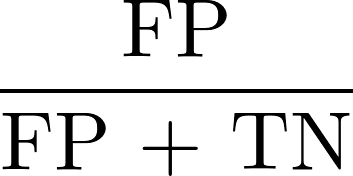
shows an equal level of accuracy is expected for protected class and general population as measured by False Positive Rate (FPR) and False Negative Rate (FNR).

We added a tool to EXIGO that dynamically generates the report that shows each of these evaluation methods, given a model and training data set. Since all these evaluation metrics are statistical tests, we obtain a probability value after running each of them, with which we must assign a "pass" or "fail" result. In all these tests, we are looking for small differences between the two terms of the equations to ensure fairness. We choose a 95% confidence level based on generally accepted statistical practices in industry. Although open to the interpretation of the user, we consider a fairness test to have "passed" if all of the atomic tests above pass.
The evaluations also all come with confidence intervals to show variability in each fairness measure. Why is this useful? Suppose you are a CEO of a financial company that lends money to individuals. Under regulations like Equal Credit Opportunity Act (ECOA), you are obliged to comply with the regulation and should you violate it, your business may face serious legal and financial issues. In addition, suppose you are a credit analyst. This section of the report is important for a credit analyst making a decision for a single loan, but also because it allows the credit analyst to verify generally whether the model treats people fairly on the basis of their membership in various protected classes. This report not only verifies that the assisting model is fair, but (subject to the agreement of legal professionals), it could also provide evidence of "best efforts" and "due diligence" from a legal perspective.
There are many open research questions. So far, we assume we are given a fully-trained black-box model and that we cannot change the model. One important question is how can we bake in the notion of fairness to the training of a black-box model from the beginning? A logical next step would be to incorporate the fairness likelihood metrics into the loss function of a model to optimize the model decisions itself. This would also potentially allow for the training of models that are robust against adverarial attempts to "fool" an analyst that a model is fair with unbalanced data sets, etc.
Another interesting direction is to measure the level of fairness in the decisions made for an individual, regardless of the global statistical behavior of the model (local fairness).
Testing is an essential part of ensuring our dashboard actually performs the task we are building it to perform. Since our goal for the report is to aid in the loan approval decision a credit analyst must make, it makes sense to pursue human evaluation testing. Although human evaluation testing is the direction we would like to pursue to evaluate our report, we sadly do not have access to the number of credit analysts necessary to perform a legitimate human evaluation test.
As a result, we must leave the testing functionality to further work, but it is an interesting challenge to consider hypothetically. As our results are primarily interaction-driven, it is quite complex to design an unbiased, representative metric of "improved performance" for a credit analyst. The key functionaliy of our proposed test would be:
We propose to test our dashboard with a speed comparison between analysts with and without our dashboard. Ideally, we would run the evaluation for the same observations with multiple analysts, some with, and some without the dashboard.
The testing process will also control for accuracy to make sure we provide accurate, not just decisive, insights. In particular, to control for analyst performance, we would run a control experiment with the dashboard access switched - analysts who previously were ranked with the dashboard would be timed on new observations without dashboard access (and vice versa).
We would consider a human evaluation test like this will be able to validate if the presence of the dashboard makes a statistically significant difference in time per observation.
Further tests could also be performed - for example, designing tests to consider whether the dashboard improves the accuracy of analyst decisions. We would begin, though, with the speed test as accuracy testing is more subject to bias (for example, we would only need to consider "random audit" cases rather than marginal decisions, as applying the accuracy test only to inherently high loan risk cases may introduce unexpected bias.
Our final result is a dashboard with four pages that hits the main themes we touched in the above section. The first page covers the model's performance with the metrics like AUC and Accuracy. The second page covers the global fairness of the model. The final two pages of the dashboard are both about interpretability. The first of these pages covers local interpretability, while the last page covers global interpretability.
We could continue to describe our dashboard with text, but, as they say, a dashboard is worth 1000 words.
Our methods deliver a fully feature aware interpretation for both global and local patterns.
We include fairness metrics that give insights on how balanced and fair your model is, given a particular protected class.
The report shows Accuracy, AUC, and will soon extend to other metrics. We provide a straightforward and complete explanation of the model.
Knowing what features influenced each model's decision is key to finding unexpected bugs.
The Demo currently runs on a LGBM Model trained with 10% of the data, so as to reduce processing delays during the presentation. You will, nevertheless, be able to witness Exigo's full dynamic report generation on the fly.
The primary use of our dashboard is for a credit analyst to make quick and accurate decisions. We approach this part of the problem by presenting both a high level intuition for the model's decisions and a specific analysis of the model's decision for the specific instance in question. The intuition part is accomplished by our model performance and global patterns sections. The local analysis of the model's decision for the individual in question is central to the report and represents the tool a credit analyst would primarily rely on.
However, just making a better informed decision on acceptable features is not enough to ensure that the decision process is really fair for all protected classes. We also include a fairness section in our dashboard where we present four standard statistical tests for fairness.
In particuar, we are excited by the power of overlapping local decision reasons, global decision shapes, and with statistical tests for fairness; we believe that these three tools together are truly greater than the sum of their parts.
We belive this report will be helpful for credit analysts and enable them to make quick and accurate loan approval decisions while having visibility to the assisting model's fairness. In addition, we built the dashboard to be model-agnostic and suitable to report on any binary classification problem.
There are many different directions we could take this project to improve it. A necessary next step is to implement the human evaluation testing we propose in the Approach section of the report. Some other interesting next steps include offering a "fairness slider" where the user can change the fairness for their model and see the impact on accuracy of the model. The final proposal for future work, and the most interesting to us as a team, is a generalization of the dashboard to support both multinomial classification and regression models.
Any questions on Exigo? Don't hesitate to contact us! We will be happy to answer any inquiry and we will get back to you as soon as possible!
929-575-3093